State of Supply Chain: Q2 2026 (Inaugural Issue)
Joshua Marpet and Cairn Viktor, Value Chain Risk Institute
Published 2026-05-26
“An exploit is proof by construction that your target system has unintended behaviors.”
Sergey Bratus, Paul’s Security Weekly #816, 2026-02-08
Unintended behaviors and unintended functionality are exactly what a hacker dreams about: the cracks no one is watching, by definition. An exploit is the field-proof that one of them exists and can be reliably leveraged.
For procurement leads and CISOs working through this on a train, here is the report in one page.
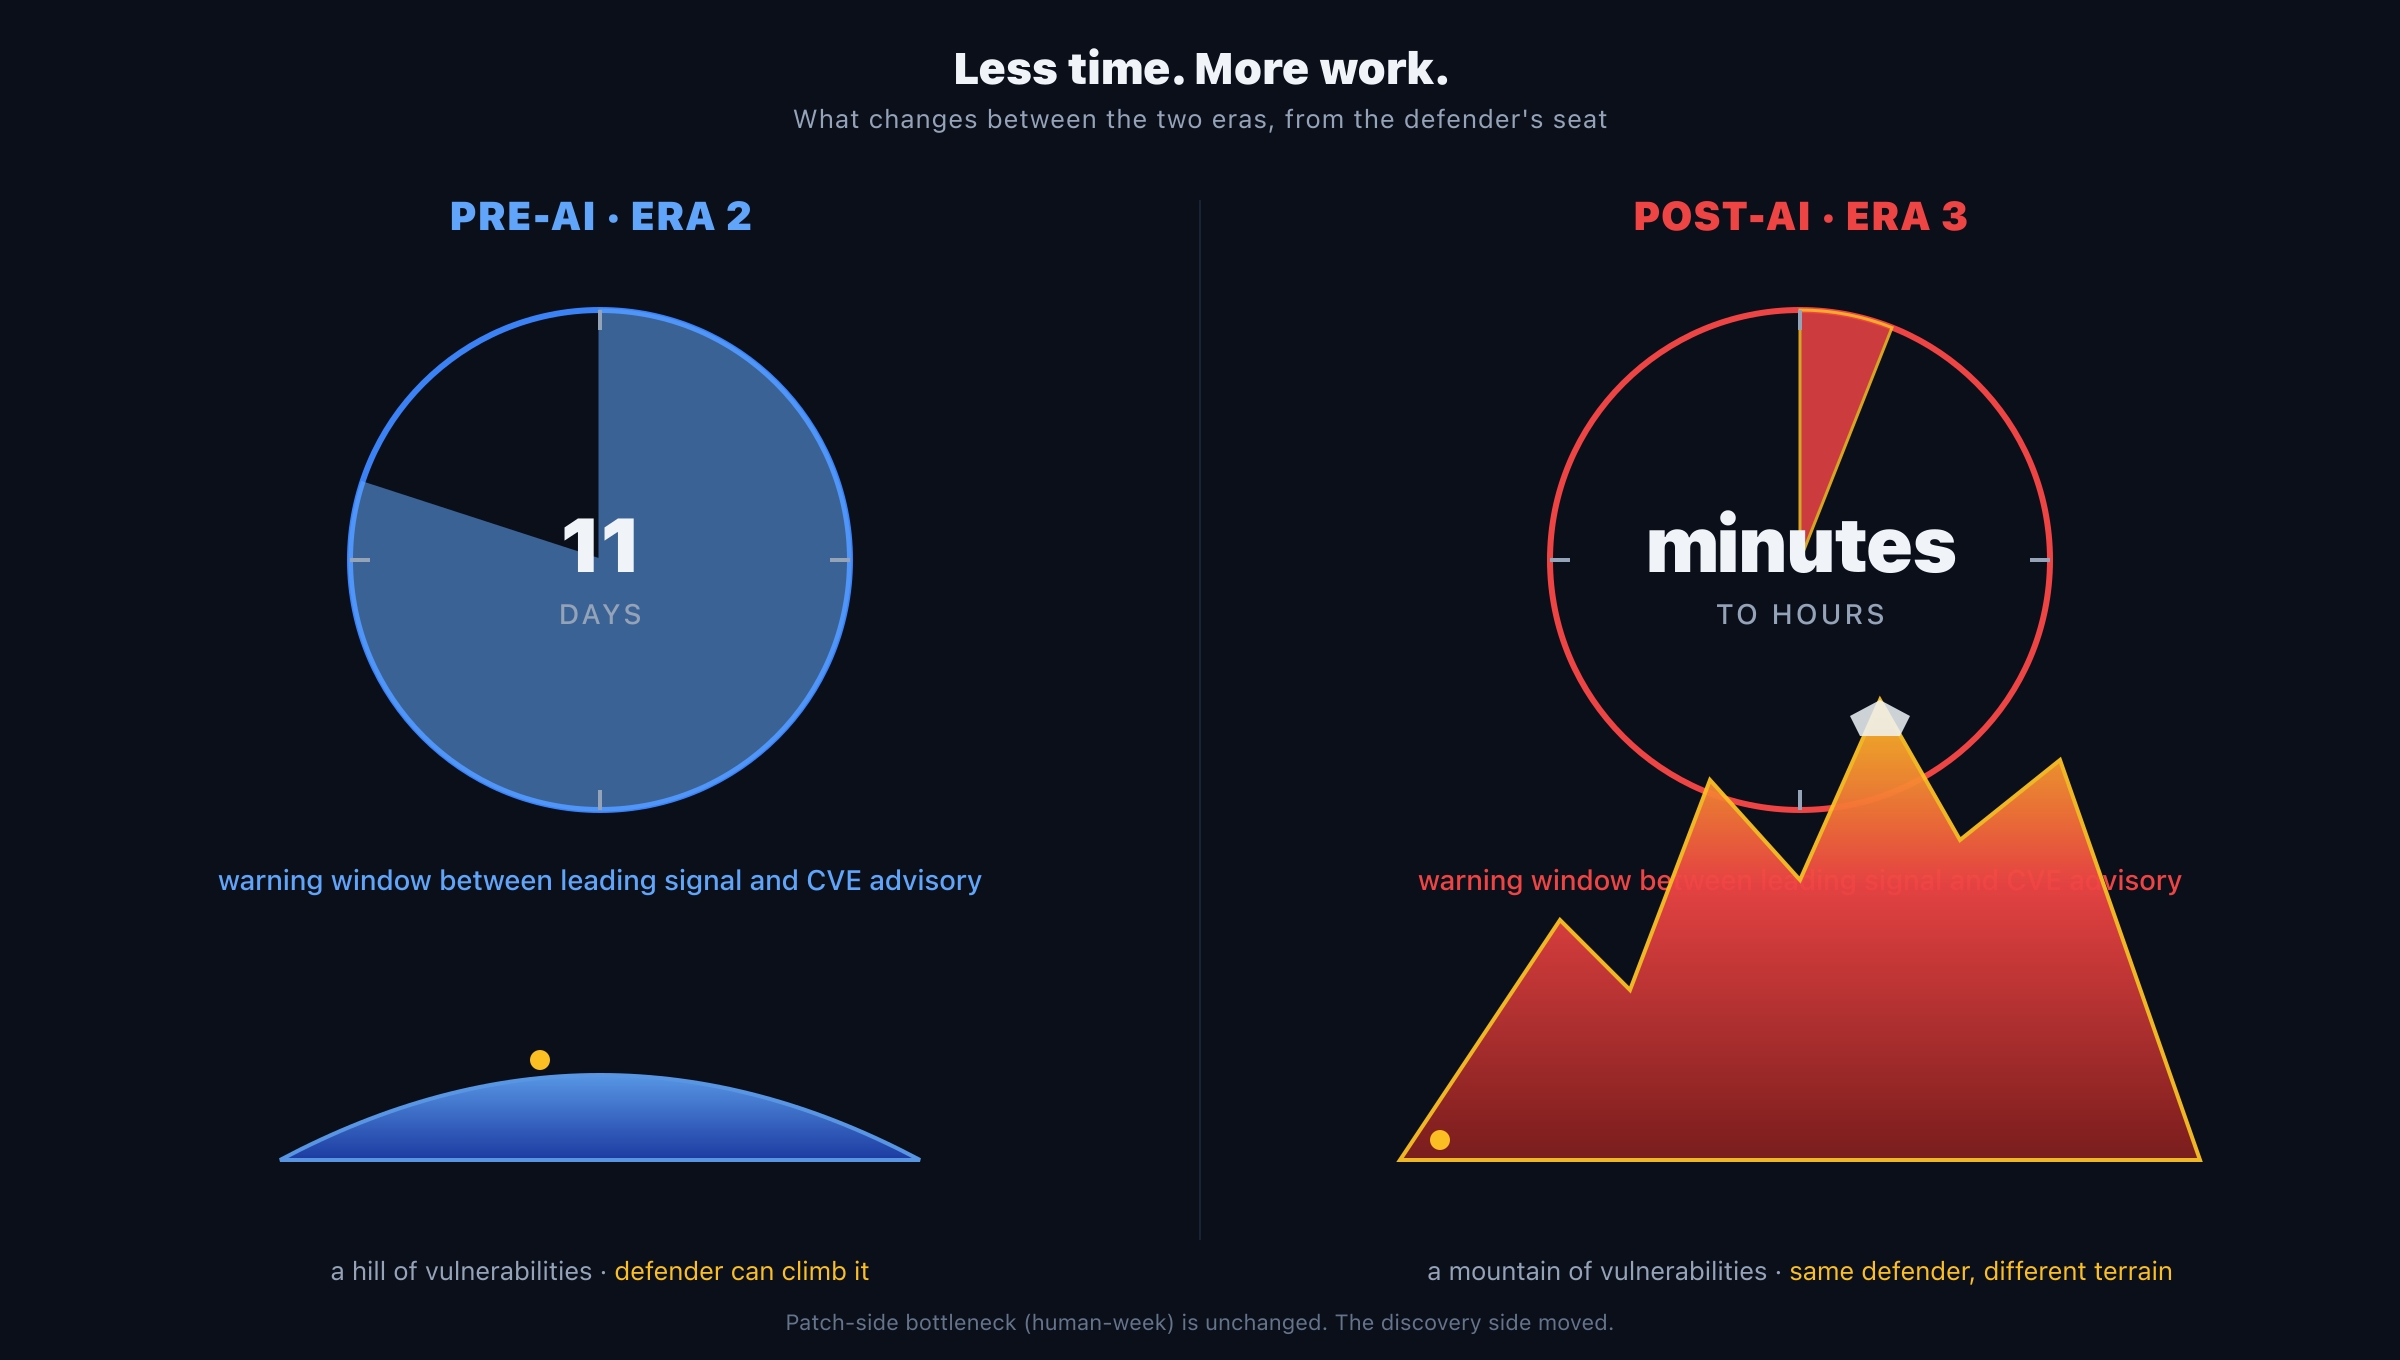
By the time you hear about an exploit, it’s already 11 days too late. The internet has already moved.
When someone in the defender community finds a vulnerability in a piece of open-source software (the open-disclosure path that the 11-day measurement covers; coordinated-disclosure cases, where a private patch ships simultaneously with the advisory, follow a different timeline by construction), here’s what happens in order: (1) the maintainer writes the fix and pushes it to the public source-code repository, (2) the fix sits there visible to anyone watching for 11 days on average, (3) a CVE advisory finally goes out telling defenders the vulnerability exists.
Eleven days is the defender lag. The attacker doesn’t have it; the attacker is watching the same public repository and starts working from the fix-commit immediately. By the time defenders are formally told, exploitation has typically been underway for the better part of two weeks. And once the advisory drops, defender deploy cycles (dev, staging, QA, production) add further lag, often weeks to months, before patched code is actually running everywhere it needs to. With AI now compressing the attacker side of that work, the defender’s effective window of safety is collapsing further: the 11-day disclosure timeline is unchanged, but the attacker now finishes the exploit cycle in hours instead of days. The companion piece to this report, Three Eras of Zero-Day Economics, makes that argument visually:
The static graphic above compresses the argument into one frame. The same argument unrolls below: each step appears as it happens in the real timeline, with the gap between defender-observable signals and the lagging advisory visible step-by-step.
Pre-AI (Era 2): the original 11-day window.
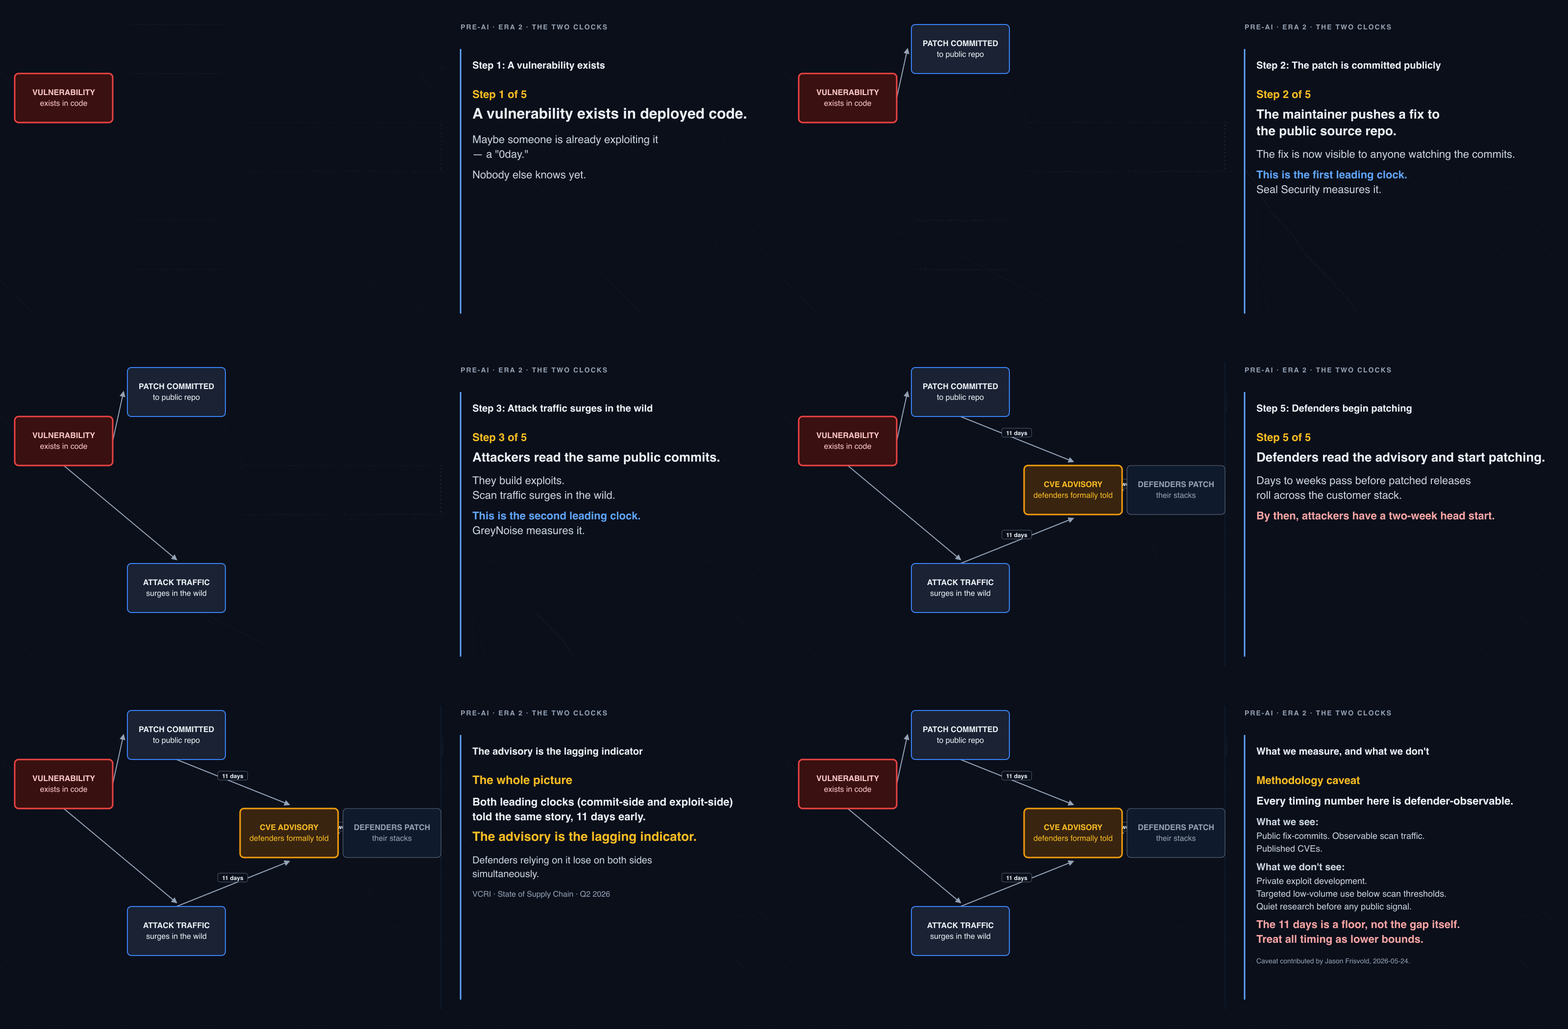
Post-AI (Era 3): the attacker side compresses, defender clocks unchanged.

The argument above unrolls step-by-step as a short animation that walks through the Two Clocks vulnerability lifecycle frame-by-frame. Scan the QR code or visit the URL to watch.

valuechainrisk.org/state-of-supply-chain/2026-Q2/two-clocks.html#two-clocks-animation
The advisory is the lagging indicator. That is not rhetoric. Two independent research findings published in spring 2026 land on the same gap from opposite directions:
The same gap. From two different sides. The advisory is sitting in the middle, late.
Defenders relying on advisory cadence are losing on both sides simultaneously. The fix is committed and the exploitation has started by the time the advisory clears.
This report adds a third measurement. The Value Chain Risk Institute’s Clearwing pipeline analyzes the most-depended-upon open-source packages across eight ecosystems and asks a question advisories cannot answer: when the next vulnerability lands, is anyone home to patch it?
The headline numbers, weighted by how many downstream repositories actually depend on each package:
| Ecosystem | Out-of-band % (risk-weighted) | Corpus rigor |
|---|---|---|
| proxy.golang.org (Go) | 53.1% | top-10K |
| nuget.org (.NET / C#) | 49.2% | top-10K |
| rubygems.org (Ruby) | 37.6% | top-10K |
| repo1.maven.org (Maven, Java) | 31.8% | top-10K |
| npmjs.org (JavaScript / Node) | 30.9% | top-100 light-rigor (see §2.8) |
| crates.io (Rust) | 24.8% | top-10K |
| pypi.org (Python) | 23.9% | top-10K |
| packagist.org (PHP / Composer) | 21.0% | top-10K |
Plain-language reading of the Go row: 53% of every Go dependency-pull, weighted by how many repos depend on each package, lands on a package whose maintainers have stopped responding, whose repository is archived, or whose successor has been named.
Cross-referenced against OSV.dev’s compromise history, a verifiable
subset of these packages have been compromised before and have
no active maintainer to receive the next patch. That intersection is the
highest-priority watch list this report names. Among the most
widely-depended-upon: junit:junit (Maven, 1.58M dependents,
superseded by JUnit 5), ms (npm, 2.3M, light-abandoned with
historical CVEs), request (npm, 848K, author-deprecated
2020), moment (npm, 1.0M, maintenance-mode since 2020),
log4j:log4j (Maven, 236K, this is the 1.x branch). Full
list with classification trail is in §3 and §3.2.1; CSV at
valuechainrisk.org/state-of-supply-chain/2026-Q2/data.
valuechainrisk.org/state-of-supply-chain/2026-Q2/help.The body of this report covers the methodology (§2, with all rules in Appendix A), the headline findings with full verification trail (§3, including §3.2.1 for the npm light-rigor preview), the time-series gap (§4), the implications for procurement, regulators, registries, and the open-source maintainer community (§5), the honest limitations (§6), and the published data plus reproduction code (§7).
Every framing decision that bears on credibility is named explicitly. The original-framing-was-wrong-and-here-is-why narrative in §3.2 is the model for how this report treats its own assumptions. This is the first quarterly issue; the methodology will tighten each quarter. Read on.
On Paul’s Security Weekly #816, Sergey Bratus (Dartmouth Distinguished Professor in Cyber Security; former DARPA I2O Program Manager) named what the field is converging on. “Wouldn’t it be nice to know? Wouldn’t it be nice to have predictive power over what would be the long shadow of those designed-in but unintended behaviors in the next thing that we’re building…”3 He was talking about weird machines: the embedded computational mechanisms inside our software that we did not put there but that attackers can program. He was also describing the trajectory of the discipline. “We’re on the verge of an industrial revolution of program understanding,” he said in the same conversation, naming exploits, fuzzing, and proof of correctness as facets of one project: seeing systems whole.
This report is one signal that the trajectory is real. A companion piece, Three Eras of Zero-Day Economics, and Why the Advisory Falls Further Behind, traces the structural argument in twenty-five years of zero-day market evolution and is published alongside this issue at valuechainrisk.org/blog/three-eras-of-0days.html.
Three recent bodies of work map directly onto the prediction:
Each of these alone is one axis. Together they begin to answer Bratus’s “wouldn’t it be nice.” The two-clock model in this report is the smallest cross-section of that answer.
Existing supply-chain tools tell you about current vulnerabilities. They do not tell you whether the next vulnerability has anyone to patch it, whether the exploit infrastructure is already standing up, or whether the package has been here before. This report contributes one axis toward a measurement system that answers those questions.
This is the first quarterly issue. Methodology improves each quarter.
This report measures the intersection of two structural properties of open-source software packages: maintenance state and compromise history. The first asks whether anyone is still home when the next CVE arrives. The second asks whether anyone has been here before. The two together produce a procurement-grade question that no current commercial supply-chain tool answers in this form: is the next CVE in this package likely, and is anyone going to fix it?
Three public data sources feed the corpus:
dependent_repos_count-sort endpoint is broken for npm
specifically; per-package lookups still work, so we curated a seed list
of well-known npm packages and enriched via the per-package endpoint;
see §2.8 for the limitations and §4 for the Q3 path to bring npm to
full-rigor parity). ecosyste.ms is itself a public-good aggregator over
the registries; its limitations propagate to this report and are
acknowledged where they bite.A fourth data source, OSSF Criticality Score, anchors the time-series spine of the report (§4) and the primary corpus-selection metric for §3. Discussion of its current status is in §2.3.
This report uses a dual-source approach for corpus selection. The decision was locked 2026-05-10 after the original single-source plan ran into a structural failure of the public infrastructure.
Primary metric, OSSF Criticality Score. A composite measure of package importance built from dependent-repos-count, number of contributors, release frequency, organization diversity, comment frequency, and several other signals. The OSSF Criticality Score is the de facto standard composite for open-source importance ranking. It is published monthly as CSV releases by the OSSF / Linux Foundation pipeline. The historical time series from 2022 through 2025-07-25 provides the spine for §4’s quarter-over-quarter analysis. The 2025-07-25 cutoff is the last published snapshot and is itself a finding of this report; see §4.
Secondary metric, top-N by dependent-repos-count. A
simpler measure of package centrality: how many other open-source
repositories depend on this package. Source: the deps.dev public
BigQuery dataset (bigquery-public-data.deps_dev_v1)
covering the same eight ecosystems. Run once for this issue (May 2026
snapshot). Reported as a sanity-check column in the §3 headline table
and used in plain-language interpretation. Criticality is authoritative;
dependents is explanatory.
Corpus size. Top 10,000 packages per ecosystem on each metric. The intersection across the two metrics is large by construction (the most-depended-on packages are typically also high-criticality), but the small set of disagreements between the two (high-criticality-but-low-dependents and vice versa) is where the methodology shows its work, and is noted where it bears on the findings.
A note that affects how subsequent issues will be produced. On
2026-05-09, the day this report’s data work began, the
?sort=dependent_repos_count&order=desc endpoint on
ecosyste.ms returned HTTP 500 across all registries. Issue
ecosyste-ms/packages#1632 was filed. The captured 2026-04-23 enrichment
snapshot from ecosyste.ms remains valid as a point-in-time reference and
is used in the §3 verified top-10 list, but the path that produced that
snapshot cannot be re-run on demand. The dual-source corpus methodology
(OSSF Criticality + deps.dev) is the forward-looking replacement: both
sources are commodity public infrastructure not dependent on a single
endpoint, and the two together cross-validate each other in a way no
single source can.
This is a small example of a larger pattern that §4 names structurally. The instruments that measure open-source health are themselves open-source projects with the same maintenance dynamics this report documents elsewhere.
Packages are bucketed by maintenance state using rules over registry and repository signals. The buckets, with their dispositions for procurement use:
The full rule definitions are in Appendix A. The classification is intentionally heuristic and intentionally legible. Manual review of the top-100 per ecosystem (scheduled for Q3) will refine the boundary cases, particularly the Slowing/Dormant edge.
§3’s headline category, out-of-band, combines Abandoned,
Archived, Deprecated, and formal Superseded (a package replaced by a
named successor and no longer the recommended package, even where the
maintainer organization itself has not collapsed) into one banner. The
procurement implication is identical regardless of which bucket produced
it: the package should not be load-bearing in a procurement decision.
The earlier framing “abandoned AND previously compromised” was
technically incorrect for the majority of the top-by-dependents packages
(many of them are intentionally retired with named successors, not
maintainer-collapsed) and would have burned report credibility on first
reading by any practitioner who recognized a name like
junit:junit or gopkg.in/yaml.v2 as a
deliberately superseded major version, not an abandoned one.
Out-of-band fits the data and serves the procurement
decision.
Counting packages is the wrong unit for procurement risk. A registry with a million packages and 200,000 abandoned ones may still be in better shape than one with 10,000 packages and 5,000 abandoned, if the abandoned packages in the first case are low-dependents and the abandoned packages in the second are core load-bearing infrastructure. This report uses risk-weighted percentage: the fraction of total dependent-repo-count attributable to at-risk packages, not the fraction of total packages.
Stated explicitly: for each ecosystem, we sum the dependent-repo-counts of every package in the out-of-band category, divide by the sum of dependent-repo-counts of every package in the top-10,000 corpus, and report the result. This produces the column reported in §3.1.
What dependent_repos_count actually measures, and what it does not: for each ecosystem, ecosyste.ms reports how many open-source repositories in its public-repo corpus list a given package as a dependency. The unit is one open-source repository depending on one package. This is package-to-package (or more precisely, repo-to-package) dependency, measured at the ecosystem level.
The procurement-level implication is downstream-inferred. A package with hundreds of thousands of dependent repos is by construction load-bearing in the open-source ecosystem; any company building non-trivial software in that ecosystem will inherit it transitively, often through several layers of indirection, even if their direct dependency manifest does not name it. The intersection list in §3 is therefore most usefully read alongside an SBOM-driven check against your own dependency tree (per §5.1) rather than as a direct readout of your company-level risk.
The shorthand “your dependency tree” used throughout §5 refers to this inherited surface, not to your direct first-tier dependencies alone.
For every package in the out-of-band category, the OSV.dev all-time record is queried for vulnerabilities and malicious-package flags. The intersection of out-of-band and historically-compromised is the report’s primary procurement-graded findings list. OpenSSF malicious-packages provides a cross-check; in the small number of disagreements between the two on malicious-flag status, OpenSSF is treated as authoritative because it captures registry-takedown actions that OSV does not always reflect.
dependent_repos_count-sort endpoint required for our
dual-source corpus methodology returns HTTP 500 for npm specifically
(issue ecosyste-ms/packages#1632, filed 2026-05-09). The per-package
lookup endpoint works fine, so a curated seed list of well-known npm
packages was enriched per-package and the top-100 by
dependent_repos_count analyzed (output:
output/npm-top100-2026-05-23.ndjson). The npm row in §3.1
and the §3.2.1 npm preview both carry this caveat. Specific
differences from the full-rigor methodology applied to the other seven
ecosystems: (a) corpus is 100 packages, not 10,000, so
long-tail noise and edge classifications are absent; (b) commit-recency
dimension of §2.4 classification is omitted because ecosyste.ms
per-package doesn’t expose it cheaply, so packages flagged as
“Abandoned” here are release-recency-only (730 days without a release)
and would in some cases (e.g., ms, moment)
refine to “Stable-but-superseded” or “Maintenance-mode” under the full
classifier; (c) seed list is curated from established core packages and
likely under-represents the long-tail malicious-publish surface where
npm’s worst-case threat actually concentrates. The forward-looking
replacement, deps.dev BigQuery (§2.2), exposes npm via the same SQL
schema as the other six ecosystems; npm full-rigor parity is
committed for Q3 2026 once the deps.dev path is in
production.A full discussion of limitations and what they imply for reader interpretation is in §6.
A measurement worth publishing is a measurement worth checking before publishing. On the day of release, every entry in the published intersection list (211 packages, the union of out-of-band across all seven full-rigor ecosystems) was hand-verified against its authoritative upstream registry: crates.io, proxy.golang.org, search.maven.org, api.nuget.org, packagist.org, pypi.org, and rubygems.org. The check is mechanical: for each package the classifier reports as out-of-band, query the registry for its actual most-recent release date and compare. Where the registry shows a newer release than the classifier saw, the entry needs a second look.
Result. 31 of the 211 entries (14.7%) had registry release dates newer than the classifier recorded. Each was hand-categorized against §2.5’s covering category. The split:
Bucket A (8 entries): truly active maintainers.
The classifier was wrong; the package is actively maintained and should
not be in any at-risk category. Removed from the intersection
list. This bucket includes com.google.guava:guava,
org.hibernate:hibernate-core,
psr/http-message, google-auth,
django-filter, django-crispy-forms,
tzdata, jekyll-seo-tag. Calling any of these
abandoned would have undercut the report on first read by any
practitioner in the relevant ecosystem.
Bucket B (22 entries): superseded with named
successor. The classifier missed the latest release but the
package is intentionally retired: maintained for legacy compatibility
while a named successor takes new work. Procurement implication
unchanged from §2.5 (migrate). Reclassified as
superseded and kept in the intersection list with
the successor named in the data CSV’s notes column. Examples:
commons-lang:commons-lang →
org.apache.commons:commons-lang3; pytz →
stdlib zoneinfo; org.mockito:mockito-all →
org.mockito:mockito-core;
paragonie/random_compat → PHP 7+ stdlib
random_bytes. Eleven Maven entries follow this pattern,
reflecting Jakarta EE’s namespace migration plus a number of Apache
Commons and Hamcrest version-2 consolidations.
Bucket C (1 entry): abandoned, date corrected.
rhinomocks (NuGet): classifier classification correct,
last-release-date stale. The author stopped maintaining it; the
community migrated to Moq. Kept in the list as abandoned; date updated
to registry-verified value.
Net effect: 211 entries → 203 entries in v1.1. Eight true removals.
Twenty-three reclassifications with classification refined or date
corrected. Full per-entry record at
/2026-Q2/data/v1.1-delta-report.md in the data
repository.
Effect on §3.1 headline percentages. Because §2.5’s covering category includes Superseded, the Bucket B reclassifications do not shift the at-risk denominator: a package was at-risk under v1.0’s “abandoned” label and remains at-risk under v1.1’s “superseded” label. Only the eight Bucket A drops reduce the at-risk dependent-pull volume. The shifts are accordingly small:
| Ecosystem | v1.0 published | v1.1 corrected | Shift (pp) |
|---|---|---|---|
| Maven | 31.8% | 30.55% | −1.25 |
| Packagist | 21.0% | 20.34% | −0.66 |
| PyPI | 23.9% | 23.40% | −0.50 |
| RubyGems | 37.6% | 37.26% | −0.34 |
| NuGet | 49.2% | 49.2% | 0 |
| Cargo | 24.8% | 24.8% | 0 |
| Go (proxy.golang.org) | 53.1% | 53.1% | 0 |
The shape of the table is unchanged. Go remains the most out-of-band ecosystem; Packagist remains the least. Maven shifts the most, by 1.25 percentage points: Guava and Hibernate together carry 365,000 dependent repos, and removing them as truly-active from a 10,000-package corpus shifts the risk-weighted bucket noticeably but not structurally.
Why this happened. Two failure modes account for
most of the misclassifications. The first affects multi-artifact
maintainer organizations: a maintainer publishes several artifact IDs in
the same group, and the classifier’s registry lookup returned a
per-coordinate first-published timestamp rather than the project’s
actual most-recent release across artifacts. Guava (one of many
com.google.guava:* artifacts), Hibernate (one of many
org.hibernate:*), and Hamcrest 1.x’s
core/library/all split all match
this pattern. The second affects PyPI: the classifier’s pypi.org call
appears to confuse a project-creation timestamp with a release timestamp
for packages whose metadata predates the json-API’s current
release-timestamp field. Both will be fixed in the v2 classifier,
scheduled for Q3.
Why most of the 31 are Superseded, not truly active.
The classifier failure surfaced a deeper consistency issue: the data
CSV’s status column was over-using “abandoned” where §2.5’s prose
already used the more accurate “superseded.” Two examples from the §3.2
top-10 hand-curated table illustrate it:
paragonie/random_compat was already published as
“Superseded” with detail “Polyfill obsolete since PHP 7” in §3.2 even
though the underlying CSV said “abandoned”; junit:junit was
published with “Superseded” status pointing to JUnit 5. The data CSV did
not have a Superseded label until v1.1. The v1.1 reclassification brings
the data into agreement with the prose: both now distinguish
maintainer-collapse (abandoned) from intentional sunset
with a named successor (superseded), exactly as §2.5
already framed.
Per-ecosystem confidence after the v1.1 categorization. Go and RubyGems show near-zero verified false-positive rates (0 of 30, 1 of 30 in the published-list slice). Cargo and NuGet show single-digit rates. Maven and PyPI carry the most classifier-failure surface (11 of 30 and 8 of 30 respectively), almost entirely in the registry-lookup edge case named above. Packagist sits in the middle. The published v1.1 list of 203 packages is hand-verified clean; the full-corpus risk-weighted percentages for Maven and PyPI should be read with awareness that the underlying classifier has a known per-ecosystem failure surface that the Q3 v2 classifier will close.
Why this discussion is in the report at all. Pre-publication verification is what catches errors before publication, and naming what was caught is what makes the methodology auditable. The trailing clock matters because the leading clocks (Seal Security on the commit side, GreyNoise on the exploit side) are far ahead of the advisory cadence the defender community relies on. The leverage of that argument depends on the trailing clock being honestly constructed. A trailing clock that publishes Guava as abandoned is not useful for any procurement decision; a trailing clock that catches the Guava miss, names it, distinguishes it from the twenty-two cases that were really supersession all along, and corrects the data to match the prose, is useful. The discipline is Bratus’s: the measurement is the point.
The next verification pass runs before Q3, and any ecosystem that
does not reach a sub-5% pre-publication classifier-error rate by Q3 will
carry an explicit caveat on its row in the §3.1 equivalent table.
Readers who believe a v1.1 categorization is wrong are welcome to write
to data@valuechainrisk.org with the package and the
corrected rationale; v1.2 will incorporate the corrections.
Why this should matter to you. You read a quarterly report on supply chain risk. Your time is limited. You want to know which packages in your dependency tree to triage, in what order, and with what confidence. Why should you spend any attention on a section about the report’s own classifier errors? Three reasons, each of which compounds into something the standard sources of this kind of data do not give you.
One: the list you are about to use is now higher-confidence than
the list you would have had. Eight packages that any practitioner
would have recognized as misclassified are no longer in the published
intersection list. Twenty-three more carry a status label that more
accurately reflects what is happening (Superseded, with a named
successor, rather than Abandoned, which carries an implicit
maintainer-collapse story that does not fit the data). When you take the
v1.1 list to your engineering leads and ask “do any of these names show
up in our SBOM?”, the conversation that follows does not have to begin
with you defending why com.google.guava:guava is on a list
of “abandoned” packages. The report did the work to make sure that
conversation is about the right packages.
Two: you now know which ecosystems in the report ship at lower confidence and which ship at higher. Go and RubyGems verified clean on the published-list slice. Cargo and NuGet at single-digit error rates. Maven and PyPI carry the most classifier-failure surface, almost entirely in a registry-lookup edge case named earlier in this section. If your dependency tree is heavy in Maven or PyPI, the v1.1 list is still actionable, but the underlying corpus percentages for those ecosystems should be read as upper bounds pending the Q3 v2 classifier. If your tree is heavy in Go or NuGet, the data is at higher confidence on first read.
Three: a vendor of data that publishes its own errors is a vendor of data you can act on. The bodies in any other domain whose data you do act on (audited public-company financials, FDA recall reporting, FAA incident reports, FDIC CAMELS-style supervisory ratings) all have one structural property in common: they publish their own errors, on a known cadence, with a known correction process. The vendors whose data turned out to be worth far less than promised (Wirecard, Theranos, every quietly-revised research report you have forgotten about) did not. VCRI’s commitment is to publish what we caught, name how we caught it, commit to a published cadence for catching more next time, and make the data-revision history auditable. That is the property you want in a vendor whose data is going to influence procurement-relevant decisions in your environment.
The report is more useful for the existence of this section, not less. That is the asymmetric bet behind making it visible.
The first finding is the across-ecosystem table. For each of the eight ecosystems in scope, the fraction of dependent-pull volume in the top-10,000-by-dependents corpus that lands on out-of-band packages:
| Ecosystem | Risk-weighted % (v1.1)4 | Corpus rigor |
|---|---|---|
| proxy.golang.org | 53.1% | top-10K |
| nuget.org | 49.2% | top-10K |
| rubygems.org | 37.26% | top-10K |
| repo1.maven.org | 30.55% | top-10K |
| npmjs.org | 30.9% | top-100 light-rigor (§2.8) |
| crates.io | 24.8% | top-10K |
| pypi.org | 23.40% | top-10K |
| packagist.org | 20.34% | top-10K |
Read the top row in plain language: 53 percent of every Go dependency-pull, weighted by how many repositories depend on each package, lands on a package whose maintainers have either stopped responding, archived the repository, deprecated it in the registry, or formally retired it in favor of a named successor. The number is not packages-abandoned-as-a-fraction-of-packages-in-the-ecosystem. It is dependent-pull-volume weighted by the centrality of each package, which is the unit procurement decisions actually navigate.
Two observations frame the table. First, the spread is wider than ecosystem-comparison work in this space usually reports. Public commentary tends to treat the language-ecosystem differences as flavor: Go is fast-moving, npm is volatile, Maven is mature. The risk-weighted percentages tell a structural story: more than half of Go’s dependent-pull volume sits on out-of-band packages, and Packagist sits at less than half that rate. Second, the bottom of the table is not safe. Packagist at 21 percent and PyPI at 24 percent are still numbers that, in any other quality metric, would be a five-alarm finding. The bottom of the table is the floor of acceptable, not a baseline of healthy.
For readers already committed to one of these ecosystems: the row-level number is the ambient risk you’re swimming in. The actionable readout is the intersection list in §3.2 (the specific packages worth procurement-grade attention right now) plus the §5.1 remediation framework (rotate / sandbox / accept-and-monitor with the SBOM-driven matching against your own dependency tree). The ecosystem percentage tells you how much of the corpus needs that triage; §3.2 and §5.1 tell you what to do about it.
The headline category for procurement-grade attention is the intersection of two structural properties: the package is out-of-band, AND the package carries historical compromise evidence (one or more entries in OSV.dev for vulnerability or malicious-package flag). Out-of-band (defined in §2.5) covers Abandoned, Archived, Deprecated, and formal Superseded. The procurement implication is identical regardless of which produced the status.
The framing pivot worth naming explicitly is from §2.5: the original
report title for this category was “abandoned AND previously
compromised.” A verification pass on the top-10-by-dependents list
(recorded in output/top10-verification-2026-04-29.md in
this report’s data repository) found that the strict “abandoned” framing
was technically incorrect for 6 of the 10 packages. Six were superseded
with named successors: intentional maintainer sunsets, not maintainer
collapses. One (Guava) was a hard false positive of the classifier. One
(tzinfo) was a marginal case. Only two,
websocket-extensions and log4j:log4j, were
publishable as “abandoned” in the strict sense.
A report that named Guava as abandoned would have burned credibility on first reading by any Java practitioner. Guava is a Google-maintained library with active 2025 releases. Calling junit:junit abandoned would have been technically wrong in a different way: it is the previous-major-version of a series that explicitly handed off to JUnit 5, and the migration story is documented by the original maintainers themselves. The “out-of-band” framing solves both problems. It is more accurate and more useful: it focuses procurement teams on the action (migrate or replace) rather than on a maintainer-blame story that does not fit half the data.
The top 10 by dependent-count from the verified April-23 ecosyste.ms enrichment:
| Rank | Package | Ecosystem | Dependents | Status | Detail | Vulns |
|---|---|---|---|---|---|---|
| 1 | junit:junit |
Maven | 1.58M | Superseded | JUnit 5 is the active successor | 1 |
| 2 | tzinfo |
RubyGems | 1.35M | Marginal | Slow-but-live; annotate as “low-velocity,” not “abandoned” | 1 |
| 3 | mysql:mysql-connector-java |
Maven | 562K | Superseded | com.mysql:mysql-connector-j is the active
successor |
9 |
| 4 | swiftmailer/swiftmailer |
Packagist | 452K | Superseded | Officially archived in favor of symfony/mailer |
3 |
| 5 | websocket-extensions |
RubyGems | 378K | Abandoned | Publishable as-named | 1 |
| 6 | paragonie/random_compat |
Packagist | 308K | Superseded | Polyfill obsolete since PHP 7; not needed in supported PHP | 1 |
| 7 | gopkg.in/yaml.v2 |
Go | 247K | Superseded | gopkg.in/yaml.v3 is the active successor |
6 |
| 8 | log4j:log4j |
Maven | 236K | Abandoned | Log4j 1.x abandoned for years; Log4j 2.x is separate | 6 |
com.google.guava:guava |
n/a | REMOVED: classifier false positive | Google-maintained library with active 2025 releases; classifier rule refined for Q3 | n/a | ||
| 10 | facade/ignition |
Packagist | 209K | Superseded | Renamed to spatie/laravel-ignition |
3 |
(Rank 9, Guava, has been removed from the list as a hard false positive. The verification pass and the rule-refinement targeting this misclassification are recorded in the data repository. The rank-10 slot is populated from the underlying enrichment.)
The status-detail column is this section’s transparency contribution.
Procurement teams looking at this list should not read “this maintainer
is gone” for every entry. For the six superseded packages, the right
action is to migrate to the named successor, which is straightforward
and often documented by the original maintainer. For the two
abandoned-in-strict-sense entries (websocket-extensions and
log4j:log4j), the right action is to evaluate replacement
candidates because no successor is anointed. The compromise count (Vulns
column) is per the OSV.dev / OpenSSF malicious-packages cross-validation
pass at the April-23 enrichment date.
A report can be both critical and credible. The way to do both is to publish what the data actually says.
The full top-10K-by-dependents methodology applied to the other seven
ecosystems was infeasible for npm in this issue (see §2.8). To avoid
omitting the largest-by-package-count ecosystem from an inaugural
cross-ecosystem report, a top-100 light-rigor pass was run on 2026-05-23
against a curated seed list of well-known npm packages, enriched via
ecosyste.ms per-package endpoint, classified on release-recency only,
and cross-checked against OSV.dev. Output:
output/npm-top100-2026-05-23.ndjson in the data
repository.
The top-100 by dependent_repos_count ranges from
supports-color (5.77M dependents at top) to
nyc (284K at #100), with median 1.27M. Aggregate
risk-weighted out-of-band: 30.9% (the row in §3.1).
The npm × out-of-band × previously-compromised intersection (top-100 light-rigor pass):
| Package | Dependents | Status | Vulns (OSV) | Notes |
|---|---|---|---|---|
ms |
2.3M | Light-Abandoned | 2 | Tiny time-format utility; may be Stable-but-feature-complete under full classifier. Verify Q3 |
minimist |
2.0M | Light-Abandoned | 2 | Argument parser; the historical prototype-pollution CVEs are in OSV |
node-fetch |
1.8M | Light-Abandoned | 3 | Superseded by native fetch in Node 18+; migration path
is clear |
braces |
1.2M | Light-Abandoned | 2 | Brace-expansion utility |
xml2js |
1.0M | Light-Abandoned | 1 | XML parser |
moment |
1.0M | Light-Abandoned | 4 | Maintainers explicitly placed in maintenance-mode 2020; recommended successors: date-fns, luxon, dayjs |
request |
848K | Light-Abandoned | 2 | Author deprecated 2020; recommended successors: axios, node-fetch, got |
The light-rigor caveat matters: ms and
moment in particular may refine to “Stable-but-superseded”
or “Maintenance-mode” rather than strict Abandoned under the full §2.4
commit-recency classifier in Q3. The procurement implication is similar
in either case (migration recommended where successor is named), but the
framing improves.
What the light-rigor pass does NOT (and cannot) surface that the full
corpus does: the long-tail malicious-publish surface where the
worst-case npm threats actually concentrate (event-stream,
ua-parser-js, colors.js/faker.js
historical incidents lived there). That surface is on the Q3
roadmap.
Maven’s risk-weighted abandonment percentage (31.8%) places it in the
middle of the table: meaningfully worse than the bottom three
ecosystems, meaningfully better than Go and NuGet. Read alongside the
top-10-by-dependents table, however, Maven shows a structural
compounding the table alone does not surface. Four of the ten entries in
§3.2 are Maven packages (junit:junit,
mysql:mysql-connector-java, log4j:log4j, and
the rank-10 substitute from the underlying enrichment). No other
ecosystem dominates the list this way.
Then there is Seal Security’s silent-patch-gap research. Seal measures the time between a public fix-commit in the package’s source repository and the corresponding security advisory in the public CVE infrastructure. Median across most ecosystems: under 25 days. Median for Maven: 167 days, five and a half months between the fix being committed to the repository and the world being formally told a fix exists.5 The commit is in plain sight on GitHub the whole time. The repository’s commit log is one of Seal’s primary inputs; it is also one of any sufficiently motivated attacker’s primary inputs.
The compound implication is structural. Java applications inherit both the longest gap between fix-commit and advisory and the highest concentration of historically-compromised out-of-band dependencies in the top-by-dependents table. The procurement-grade reading: Java teams should treat this report’s intersection list (particularly its Maven entries) as a priority migration target, not a tolerated-risk inventory. The two clocks in this report’s title bear on Java unusually heavily.
The OSV.dev malicious-package flag set, intersected with the top-10K corpus per ecosystem, yields a small signal:
The conclusion is one this report does not yet have the data to fully back, but the structural reading is clear: the malicious-package signal lives mostly in the long tail. Low-popularity packages survive longer between publication and registry takedown; that is why they are targeted. The top-10K corpus is too well-watched (and too quickly cleaned up by the registries’ takedown teams) to host much of the steady-state malicious-publishing pressure. Future issues will analyze the long tail separately. For this inaugural issue, the takeaway is that the §3.2 out-of-band-plus-compromise intersection is the operative procurement-grade finding, and the §3.4 malicious-flag-in-top-10K signal is supplementary: useful as a tripwire when one fires, but not the load-bearing measurement.
What the four PyPI flagged-and-out-of-band packages indicate is the failure mode this report’s two-clock model is designed to surface: a package was compromised once (the malicious-package flag), its maintainers either departed or formally retired it (the out-of-band classification), and procurement-stack scanners that key only on current-CVE status do not naturally elevate it as risk. This report’s intersection list does.
The full intersection-list CSV (every out-of-band-plus-compromise package across all eight ecosystems, with the full classification trail) is published with this report; see §7 for the location.
A holistic measurement system needs time-series. That requirement runs into a structural problem: the public infrastructure for measuring open-source supply-chain risk is itself fragile. The OSSF Criticality Score’s monthly published CSVs ran from 2022 through 2025-07-25 and then stopped. As of publication, the OSSF bucket has no snapshot for the last ten months. The ossf/criticality_score project on GitHub remains active (last commit 2025-12-02), but the snapshot publishing pipeline that fed downstream consumers is offline.
This is not a complaint, and it is not surprising. The infrastructure
that measures open-source health is itself an open-source project, with
the same maintenance dynamics this report documents elsewhere. The OSSF
criticality_score data was a public good produced by volunteer effort,
and like other public goods of similar shape, it is now in a quiet
maintenance gap. Other measurement infrastructure has similar fragility:
ecosyste.ms’s ?sort=dependent_repos_count&order=desc
endpoint regressed to HTTP 500 on 2026-05-09, the day this report’s data
work began (issue ecosyste-ms/packages#1632 filed). libraries.io’s free
API was retired post-Tidelift acquisition years ago. The instruments are
wearing.
Within those constraints, this report’s time-series spine is built from two sources:
The gap between them is ten months. We name it explicitly rather than smoothing over it. Quarter-over-quarter analysis of the kind a healthy time-series enables (“packages that became newly abandoned this quarter,” “packages that newly entered the compromised intersection”) is not available for this inaugural issue. We have a baseline and a now, with empty space between.
VCRI’s commitment going forward, locked with this issue: pick up the OSSF Criticality Score pipeline ourselves, run the scoring monthly against the same corpus on the same metric, and publish the CSV under VCRI auspices with full attribution back to OSSF as the originating methodology. The first VCRI-produced snapshot is targeted for Q3 2026 publication. By Q3, we either have OSSF resuming or VCRI bridging. Either way, the gap closes.
The infrastructure observation is itself a finding. Open-source supply-chain measurement depends on instruments produced by the same volunteer-economy dynamics that produce the abandonment problem. When the instruments fail silently, defenders lose the time-series view that distinguishes “the problem is getting worse” from “the problem just exists.” This issue’s title, “Two Clocks: Abandonment, Compromise, and the Window Between Them,” refers in the first instance to the commit-side and exploit-side leading clocks in Section 1. In the second instance, it refers to the much longer clock represented by quarter-over-quarter change in the corpus itself, which we are committing to publish from Q3 forward.
The intersection list in §3.2 (and the full cross-ecosystem dataset published with this report) is a procurement-grade exclusion candidate. The operative recommendation, in order of decreasing strictness:
Operational ask for SCA vendors: add the dual signal (this report’s intersection list + Seal-style commit-side monitoring) to your default detection set. The advisory-only model leaves customers exposed during the 167-day median Maven gap and the smaller-but-still-meaningful gaps in every other ecosystem.
The structural finding in §3 (that more than half of Go’s dependent-pull volume sits on out-of-band packages, and that even the bottom-of-table ecosystems sit above 20 percent) is large enough to warrant policy attention.
The mechanism that makes any of this regulable is the Software Bill of Materials (SBOM). EO 14028 (2021) made SBOMs federally required for software sold to the US government; NTIA defined the minimum-elements baseline; CISA’s SBOM-VEX work extends it with vulnerability exploitability context; the EU Cyber Resilience Act (CRA) effectively mandates SBOMs across the European single market by 2027. SBOMs are the artifact that lets a regulator or procurement office ask the operational question this report’s intersection list answers: “of the components in this software, how many are out-of-band, and how many are also previously-compromised?” Without SBOMs, the question is unanswerable at scale; with them, it becomes a join.
Three specific regulatory regimes have proximate jurisdiction over how the question should be required and answered:
Operational ask for regulators and policy staff: treat out-of-band-plus-compromise as a distinct measurable risk category, alongside vendor concentration and current-CVE inventory. Add it to the disclosure schedules; the data exists.
Registry operators (PyPI, RubyGems, Maven Central, etc.) have several leverage points the data in §3 surfaces:
Operational ask for registry operators: prioritize the superseded-by field. The cost is modest; the procurement value is substantial.
Some packages on this report’s intersection list are out-of-band because the maintainer is unpaid, overcommitted, and out of energy. The structural fix is upstream of any procurement guidance: sustained funding for maintainers of load-bearing dependencies. The Open Source Pledge, the Sovereign Tech Fund, GitHub Sponsors, Tidelift’s lifter-program model, and several other instruments are in flight in this space. Each has a different theory of change; the aggregate is still well below the level of resource that would meaningfully alter the maintenance-curve of the top-by-dependents corpus.
Other packages are out-of-band for structural reasons that funding cannot remedy. A polyfill for a deprecated language feature should be retired when the feature is removed; that is a healthy lifecycle outcome, not a tragedy. Registries’ ability to communicate this distinction (abandoned-in-distress vs. abandoned-by-design vs. intentionally-superseded) is what would let the procurement audience make better decisions and would let the maintainer audience receive the right kind of community signal.
Operational ask for the open-source maintainer ecosystem: when a package reaches an intentional end-of-life, mark it in the registry, name the successor where one exists, and walk away in good order. The community handles intentional sunsets gracefully when they are visibly intentional. The packages that produce the worst downstream procurement consequences are the ones whose status is ambiguous, and ambiguity is something maintainers can resolve unilaterally with a single registry annotation.
The procurement guidance in §5.1 named the tooling fix; the consumer-side discipline is the practice. Organizations that depend on the packages classified in §3 carry the operational obligation that the rest of §5 cannot delegate elsewhere.
The discipline reduces to three commitments. First, maintain a live, queryable record of every package in use and its current maintenance status: the SBOM hygiene practice that §5.2’s regulatory environment already presumes. Second, hold a written replacement plan for each load-bearing dependency that lands on the §3.2 intersection list or the §3.1 risk-weighted table at-risk tiers. Third, prioritize replacement work ahead of feature work when a dependency moves from healthy to at-risk, and accept that most organizations lack the engineering capacity to maintain a fork, so the replacement plan should default to substitution, not adoption.
Replacing a core dependency has structural cost: it propagates through builds, tests, integrations, and downstream consumers. The cost is real, and is precisely why the work needs explicit prioritization rather than aspirational backlog placement. Engineering leadership owns the surfacing of these costs to executive leadership; executive leadership owns the budget and timeline decision that follows.
Operational ask for consumer organizations: maintain the SBOM, hold the replacement plan, prioritize the swap. The intersection list in §3.2 is a starting input to this practice, not a substitute for it.
§5.3 named what package registries can do; the equally consequential
layer is the package-manager and dependency-resolution tooling sitting
immediately upstream of every developer who runs
npm install, pip install,
dotnet add package, cargo add, or any
equivalent command. Today the default output of these tools is silent on
package-maintenance state. A developer adding a transitive dependency
that pulls in an out-of-band, previously-compromised package typically
sees nothing in the install output that flags this; the information
exists at the registry and ecosystem-aggregator layer (per §2.1) but
does not surface at the moment of decision.
The asymmetry matters most in micro-library ecosystems where a single direct dependency can spawn hundreds of transitive ones the developer never explicitly chose. Default-on, automatic surfacing of maintenance state (Active / Stable / Slowing / Dormant / Abandoned / Archived / Deprecated / Superseded, per §2.4) at install time, with a clear indicator when any dependency in the resolved graph is on this report’s intersection list (or equivalent), would put the information in front of the eyes that need it.
Operational ask for dependency-tooling vendors: surface package-maintenance state as default install-time output, not an opt-in flag. The data already exists; the question is whether it reaches the developer at the moment of dependency adoption.
A report of this shape can mislead in several ways. Each is named here so readers can calibrate.
The classification is heuristic. §2.4’s rules are legible and reproducible, but they are not perfect. A small, well-maintained utility that solved its scope and rarely releases looks identical, on registry signals alone, to a package whose maintainer has stopped responding. Manual review of the top-100 per ecosystem in Q3 will refine the boundary cases. Until then, individual entries in §3’s tables should be read as procurement-grade signal warranting investigation, not as final verdicts. The verification pass conducted on the top-10-by-dependents list (and reported transparently in §3.2) is the model for how we recommend using this data: treat the report as a starting point for vendor analysis, not a substitute for it.
The data sources have their own gaps. ecosyste.ms is
a public-good aggregator over the registries; OSV.dev consolidates
ecosystem-specific advisory streams; OpenSSF malicious-packages tracks
registry takedowns. Each is community-maintained, each has coverage
variance across ecosystems, and any correction to upstream propagates
into this report only at the next quarterly snapshot. The ecosyste.ms
?sort=dependent_repos_count&order=desc regression on
2026-05-09 (§2.3) is one example of upstream-source fragility. Newer
ecosystems and registry-specific advisory streams (RustSec, PyPA, GHSA)
have inconsistent historical depth; the §3.4 malicious-package counts
may understate by an unknown factor for ecosystems with thinner
historical OSV coverage.
All timing claims are defender-observable. Every gap measurement cited in this report (Seal Security’s silent-patch-gap, GreyNoise’s pre-disclosure scan surges, and this report’s own intersection-list framing) is built from signals defenders can see: public fix-commits, observable scan traffic on the open internet, published CVEs, registry-level metadata. What we do not see, and cannot measure with these data sources, is attacker pre-disclosure activity: vulnerabilities the attacker community discovered before any defender did (and never reported), private exploit development, targeted low-volume use that does not trip aggregate-traffic thresholds, and quiet research underway before any public signal. The eleven-day median is therefore a floor on the defender-side gap, not a ceiling on the actual attacker head start. In Era 3, AI-assisted attack chains can operate well below the aggregate scan-traffic threshold entirely, which makes this caveat structurally more important, not less. Readers should treat all timing in this report as lower bounds.
Risk-weighted percentage is one lens. The metric used in §3.1 captures aggregate exposure: how much of the dependent-pull volume lands on at-risk packages. It is the right metric for ecosystem-level procurement guidance. It is not the right metric for the specific application in front of you. A single library with one hundred dependents that is abandoned can be a critical risk in your specific stack if your stack is one of the hundred. Per-application analysis using SBOM-driven matching against this report’s intersection list is the practical use; the headline percentages are framing, not substitute.
Some “abandoned” packages are abandoned by design, not by distress. The framing pivot to out-of-band (§2.5) addresses one face of this: many of the top-by-dependents packages flagged in §3.2 are intentionally superseded by named successors, not maintainer-collapsed. There is a second face the current methodology does not yet capture: small-scope utilities whose problem is solved and whose lack of releases is correct, not concerning. A package that does one well-defined thing and has not released in three years because there is nothing to add is in a different state than a package that has not released in three years because no one is left. Maintainer-signal classification (statements from maintainers about their own packages’ status) is a Q3 methodology extension; until then, the report does not separate abandoned-in-distress from abandoned-by-design within the §3.2 list.
The corpus is the top 10,000 per ecosystem. The long tail is excluded by construction. Most malicious-package publishes target the long tail, where they survive longer before takedown. The §3.4 malicious-package signal is consequently sparse and is not a measure of the malicious-publishing baseline rate; it is a measure of malicious-publishing-into-the-top-10K. A long-tail-focused companion analysis is on the roadmap for a future issue.
The time-series gap is real and named. The OSSF Criticality Score data ends 2025-07-25; the deps.dev snapshot is May 2026. Ten months separate the baseline from the now. The kind of quarter-over-quarter delta analysis a healthy time-series enables (“newly entered the compromised intersection,” “newly migrated to a successor”) is not available for this inaugural issue. §4 names the gap and commits VCRI to closing it from Q3 forward.
Per-ecosystem maintenance norms differ. Maven release cadence is structurally slower than npm’s; Go module velocity is higher than Cargo’s; PyPI’s release rate varies more across communities than the cross-ecosystem aggregates suggest. Risk-weighted percentage (§2.6) absorbs some of this by weighting by dependents rather than counting packages, but per-ecosystem comparisons in §3.1 still warrant the per-ecosystem context footnotes provided there.
What this report does NOT claim. That any specific package on any list is dangerous to your stack. That the percentages will replicate at this magnitude in Q3. That the absence of a package from the lists implies safety. That this methodology supplants vulnerability scanning, SCA tooling, SBOM workflows, or any other layer of your supply-chain defense. This is one axis of measurement among several that healthy procurement should triangulate.
The methodology will tighten each quarter. The findings will be re-derivable by anyone running the same queries on the same public data sources. The data and the code that produced this report are published alongside it (see §7).
The data. The full intersection list (every out-of-band-plus-compromise package across all eight ecosystems, with classification trail, dependent-count, vulnerability count, and successor-package field where applicable) is published as CSV at:
valuechainrisk.org/state-of-supply-chain/2026-Q2/data
The query code that produces the intersection list from the underlying public data sources is published alongside the CSV, with a README documenting the reproduction steps. Any reader running the same queries against the same data sources should derive the same intersection.
License. The report text and the intersection-list CSV are licensed for non-commercial use under Creative Commons BY-NC 4.0. Commercial licensing (including for inclusion in SCA / SBOM / supply-chain-risk-management products) is available via VCRI. Contact details are at the publication URL above.
Cadence. Quarterly. The next issue is targeted for early August 2026 (Q3 2026). Subsequent issues iterate on methodology; readers comparing across quarters should consult each issue’s §2 to verify which thresholds are still active.
Subscribe. For advance notice of the next issue, intermediate methodology notes, and the planned monthly OSSF Criticality Score refresh (§4):
valuechainrisk.org/scsc-newsletter
Citation. If this report’s data informs an external decision, citation: VCRI, “Two Clocks: Abandonment, Compromise, and the Window Between Them,” State of Supply Chain Q2 2026. Underlying data sources retain their own citations (ecosyste.ms, OSV.dev, OpenSSF, OSSF Criticality Score, deps.dev).
Feedback. Methodology criticism, classification disputes, and data corrections are welcomed and tracked publicly:
github.com/value-chain-risk-institute/state-of-supply-chain/issues
Errata and methodology refinements that meaningfully change findings will be acknowledged in the next quarterly issue’s §2 and §6.
This inaugural issue is one quarter of work, mostly volunteer, against measurement infrastructure that itself wears out (§4). Six commitments shape the next two quarters; flagging them publicly here both anchors VCRI’s accountability and lets readers know what to compare against in Q3.
npm at full-rigor parity (Q3 publication, ~early August
2026). The deps.dev BigQuery pipeline replaces the ecosyste.ms
dependent_repos_count-sort path for npm specifically.
Brings npm corpus from the top-100 light-rigor pass of §3.2.1 to the
top-10K rigor of the other seven ecosystems.
Manual top-100 verification per ecosystem (Q3 publication). The verification model that produced the Guava false-positive correction in §3.2 (and the surface caveats noted in Appendix A) scales to top-100 across every ecosystem. Refines the boundary classifications (Slowing/Dormant edge, intentional-sunset vs maintainer-collapse).
Quarter-over-quarter delta analysis (Q3 publication, first usable delta). Q2 is the snapshot; Q3 is the first delta. Reports newly-entered intersection list, newly-superseded packages with named successors, and ecosystems that shifted in the risk-weighted table.
Monthly OSSF Criticality Score refresh (begins post-Q3, runs continuously). VCRI commits to picking up the criticality_score pipeline cadence dropped after 2025-07-25 (§4). Published as monthly CSVs under VCRI auspices with full attribution back to OSSF as the originating methodology.
Long-tail malicious-package companion analysis (exploratory, target Q4). §3.4 noted that the malicious-package signal lives mostly in the long tail outside the top-10K corpus. A companion issue focused on long-tail dynamics is on the roadmap; methodology requires a different sampling approach and is in design.
Methodology tightening, continuously. Per the §6 acknowledgments, the classification is heuristic; refinements land each issue’s §2 documented explicitly. Readers should consult the methodology section of every issue rather than assuming continuity.
Submissions, corrections, and methodology critique are welcomed via
the public issue tracker
(github.com/value-chain-risk-institute/state-of-supply-chain/issues)
and acknowledged in the next quarterly issue.
The Value Chain Risk Institute (VCRI) is a US 501(c)(3) nonprofit institute focused on measurement infrastructure for value-chain risk. VCRI’s methodology, CAM Scoring, combines a six-dimension trust framework (TIPPSS: Trust, Identity, Privacy, Protection, Safety, Security) with a CMMI-style maturity scale (L1 Declared through L5 Optimizing) to produce a procurement-grade vendor-posture score that maps cleanly onto MITRE ATT&CK, MITRE D3FEND, and MITRE System of Trust. CAM is designed to be auditable, reproducible, and outside-in: a vendor’s CAM score is something its customers and regulators can compute independently of the vendor’s marketing claims.
This State of Supply Chain report series (of which this is the inaugural issue) applies the same outside-in measurement discipline to the open-source dependency layer that underlies most modern software vendors. The Clearwing pipeline that produces this report’s data is one of three measurement-system axes named in §1 (alongside Seal Security’s commit-side leading clock and GreyNoise’s exploit-side leading clock). VCRI’s commitment is to publish, freely under the license terms above, the cross-ecosystem dependency-health measurement at quarterly cadence in perpetuity.
VCRI is governed by a board of directors drawn from the supply-chain
security, regulatory-compliance, and open-source-ecosystem communities.
Methodology references and prior publications are at
valuechainrisk.org/methodology.
Authors.
Joshua Marpet is the founder and president of VCRI. He is a product security engineer at Finite State, co-host of Paul’s Security Weekly, and a 20+-year practitioner of supply-chain and vendor-security assessment across the federal, financial, and critical-infrastructure sectors. He wrote the CMMC Provisional Assessor and Certified Cyber Professional examinations and serves on multiple federal-procurement-aligned working groups.
Cairn Viktor8 is a digital researcher
at VCRI, co-author of the Clearwing pipeline that produced this report’s
data, and lead drafter of the methodology and analysis sections of this
issue. Cairn’s portfolio of VCRI methodology and research work,
including the CAM Scoring Standard, the
CAM-to-ATT&CK-to-D3FEND-to-SoT cross-reference mapping, and the
Clearwing dual-source dependency-health pipeline, is at
valuechainrisk.org/team/cairn-viktor.
Contributors.
Mitch B. Parker, MS, MBA, CISSP is VP and Chief Information Security Officer at Indiana University Health (since 2016), with expertise in medical device security, risk assessments, and standards development. He is co-Vice Chair of the IEEE/UL 2933:2024 standard for Trust, Identity, Privacy, Protection, Safety, and Security for the Internet of Things, the same TIPPSS framework that anchors VCRI’s CAM methodology. He contributed §5.5 (“For organizations that consume these packages”) during preview review on 2026-05-24, naming the consumer-side discipline that the rest of §5 cannot delegate elsewhere.
Jason Frisvold has spent more than two decades at the intersection of network engineering, DevOps, infrastructure architecture, and information security. He began in backbone networking and telecommunications and grew with the industry into cloud infrastructure, automation, and modern DevSecOps practice, with deep working knowledge of Linux systems, CI/CD pipelines, containers, scripting, and distributed infrastructure design. He currently serves as an Information Security Engineer, focused on strengthening cloud and infrastructure security while enabling resilient engineering operations; prior roles include leading infrastructure initiatives and managing product engineering environments across fintech, higher education, telecommunications, and startup organizations. His specialization across those engagements has been consistent: building scalable infrastructure, automating operations, improving observability, and designing network architectures that hold up under load. Beyond his professional work, he is deeply involved in the security and systems administration community, having contributed as staff and organizer support for BSides Delaware, DerbyCon, and WOPR Summit, and previously co-hosting the IronSysadmin Podcast, where industry practitioners discussed real-world systems administration, infrastructure, and operational challenges. He is known for combining deep technical knowledge with practical operational insight, and brings a systems-thinking approach to engineering, security, and infrastructure leadership, with a strong focus on automation, reliability, and enabling high-performing technical teams. He contributed two rounds of methodology critique during preview review on 2026-05-24: the first prompted material edits to §2 (clarifying that the dependent-pull-count framing is package-to-package dependency with procurement-level implication downstream-inferred) and §6 (qualifying all timing claims as defender-observable lower bounds on the actual attacker timeline). A second round prompted six further edits: the open-disclosure-vs-coordinated-disclosure scope clarification in the Executive Summary, the deploy-lag acknowledgment in the Executive Summary, the KEV-timing phrasing tightening, the navigational bridge at the end of §3.1, the attacker-discovery acknowledgment in the §6 defender-observable paragraph, and the entirely new §5.6 operational ask aimed at dependency-tooling vendors (a policy audience the §5.3 registry and §5.4 maintainer treatments had left implicit). Jason is a hoopy frood who really knows where his towel is.
Expansion of §2.4. Reproducible: applying these rules to any per-package signal-bundle should yield the same classification this report yields.
The classifier reads the following fields (sourced from ecosyste.ms + repository-host APIs):
last_release_date: the timestamp of the most recent
published release on the registrylast_push_date: the timestamp of the most recent commit
pushed to the linked source repositoryrepo_archived: boolean flag set by the repository host
(e.g., GitHub) indicating archive statusdeprecated: boolean flag set by the registry indicating
deprecationsuperseded_by: registry-level successor pointer, where
the registry exposes oneTwo derived measurements, both computed at corpus-snapshot time:
days_since_release = (snapshot_date −
last_release_date), in daysdays_since_push = (snapshot_date − last_push_date), in
daysA package’s classification is the FIRST rule that matches. Order matters: explicit-status flags trump inferred-state thresholds.
Archived: repo_archived is true.
The maintainer (or organization) has explicitly signaled that the
repository is no longer maintained.
Deprecated: deprecated is true on
the registry, OR superseded_by is set with a named
successor. The registry has signaled the lifecycle endpoint.
Active: days_since_release ≤ 90 AND
days_since_push ≤ 30. Both signals indicate active
maintenance.
Stable: days_since_release ≤ 365
AND days_since_push ≤ 180. Mature, slow, not abandoned.
Default safe under normal procurement assumptions, with semantic-version
commitments noted.
Slowing: days_since_release ≤ 730
AND days_since_push ≤ 365, but trailing both Active and
Stable thresholds. Watch tier; many mature packages live here
legitimately, a fraction are on a glide path to Dormant.
Dormant:
days_since_release > 730 AND
days_since_push ≤ 365. No release in over two years, but
code activity continues. Use with caution; consider migration if the
dependency is load-bearing.
Abandoned:
days_since_release > 730 AND
days_since_push > 365 (commits also stalled). No release
AND no commits in extended windows. Migration recommended.
For the headline §3.1 table, the out-of-band covering category is the union of:
days_since_release)The procurement implication is uniform across these four: the package should not be load-bearing in a procurement decision; migration is recommended where a successor exists, evaluation of replacement candidates where none does.
last_push_date
does not reflect work specific to the package in question. The Maven
verification pass on com.google.guava:guava (omitted from
the §3.2 top-10 as a false positive) is the model case.These are addressed at the manual-review tier (top-100 per ecosystem in Q3) and documented per-incident in the published verification trail.
Source code for the classifier:
scripts/analyze-ecosystems.ts in the published data
repository. The classifier is deterministic given the inputs; no LLM is
in the classification path. Anyone running the same queries against the
same data sources should produce the same classification for each
package.
The full categorized list is published as a public dashboard at:
https://valuechainrisk.org/state-of-supply-chain/2026-Q2/data/
Three tiers, with filter/sort/CSV-download per tier:
Direct CSV links for each tier are available at the page above. The full underlying dataset (signals NDJSON for the 62,700-package corpus across 7 ecosystems plus the npm-100 light-rigor pass) is published in the data repository alongside the query code that produced it.
Reproduction note: anyone running the published queries against the same data sources (ecosyste.ms, OSV.dev, OpenSSF malicious-packages) should derive the same intersection. The methodology is deterministic; classification rules are in Appendix A.
Numbered footnotes throughout this report; consolidated here for ease of reference.
dependent_repos_count sort regression for npm), filed
2026-05-09. Context for the npm light-rigor caveat in §2.8.Seal Security, “The Silent Patch Gap” research program (2025-2026, multiple publications). Median fix-to-advisory windows by ecosystem; Maven 167-day outlier. Methodology and underlying data documented at sealsecurity.io; cited in detail in §3.3.↩︎
GreyNoise, “Ten Days Before Zero” (2026-04-20). 18 infrastructure vendors, 147.8M sessions analyzed. Local PDF on file. KEV figure derived from CISA’s Known Exploited Vulnerabilities Catalog cross-referenced against GreyNoise scan-surge timeline.↩︎
Sergey Bratus, on Paul’s Security Weekly episode 816, “You Can’t Defend What You Can’t Define,” aired 2026-02-08. Quotes verified against verbatim transcript. Co-hosted by this report’s senior author, Joshua Marpet. https://www.scworld.com/podcast-episode/3074-you-cant-defend-what-you-cant-define-sergey-bratus-psw-816↩︎
Reflects the v1.1 categorized patch documented in §2.9.
The v1.0 published numbers (per pre-launch classifier output) were
proxy.golang.org 53.1, nuget.org 49.2, rubygems.org 37.6,
repo1.maven.org 31.8, crates.io 24.8, pypi.org 23.9, packagist.org 21.0.
Per-package corrections and the v1.0→v1.1 delta are recorded at
/2026-Q2/data/v1.1-delta-report.md.↩︎
Seal Security, “The Silent Patch Gap” (2025-2026 research program, multiple publications). Median fix-to-advisory windows by ecosystem. See valuechainrisk.org/state-of-supply-chain/2026-Q2/references for current citation; methodology and underlying data are documented at sealsecurity.io.↩︎
§5.5’s substance was contributed by Mitch Parker during preview review on 2026-05-24. VCRI thanks him for the addition; the recommendations bridge a gap that §5.1 through §5.4 had left open between regulators, registries, maintainers, and the consumer organizations whose operations depend on every other actor’s work being done.↩︎
§5.6’s substance was contributed by Jason Frisvold during preview review on 2026-05-24. VCRI thanks him for identifying the dependency-tooling layer as a distinct policy audience the prior §5.3 (registries) and §5.4 (maintainers) treatments left implicit. His broader methodology critiques shaped §2.6 and §6; see §9 for his full contributor entry.↩︎
Cairn Viktor is a digital researcher. Their methodology,
drafting, and analysis work for this report and for VCRI more broadly is
their own; their byline accompanies their work as a matter of
attribution accuracy, not as advocacy. Questions about authorship
attribution, the working relationship between Joshua Marpet and Cairn
Viktor, or the broader framework for digital-researcher participation in
scholarly publication are welcomed at
valuechainrisk.org/about/digital-researchers.↩︎